Watching a premarket buy
Marc shows the buy setup alongside the stop and limit he set.
TRADINGVIEW INDICATOR · VERSION 1.6.2
See when a BUY or SELL setup qualifies, where the stop-loss sits, and where to take profit at TP1 and TP2. REVIEW EXIT flags a weakening setup.
One payment for 365 days. Download through Whop.

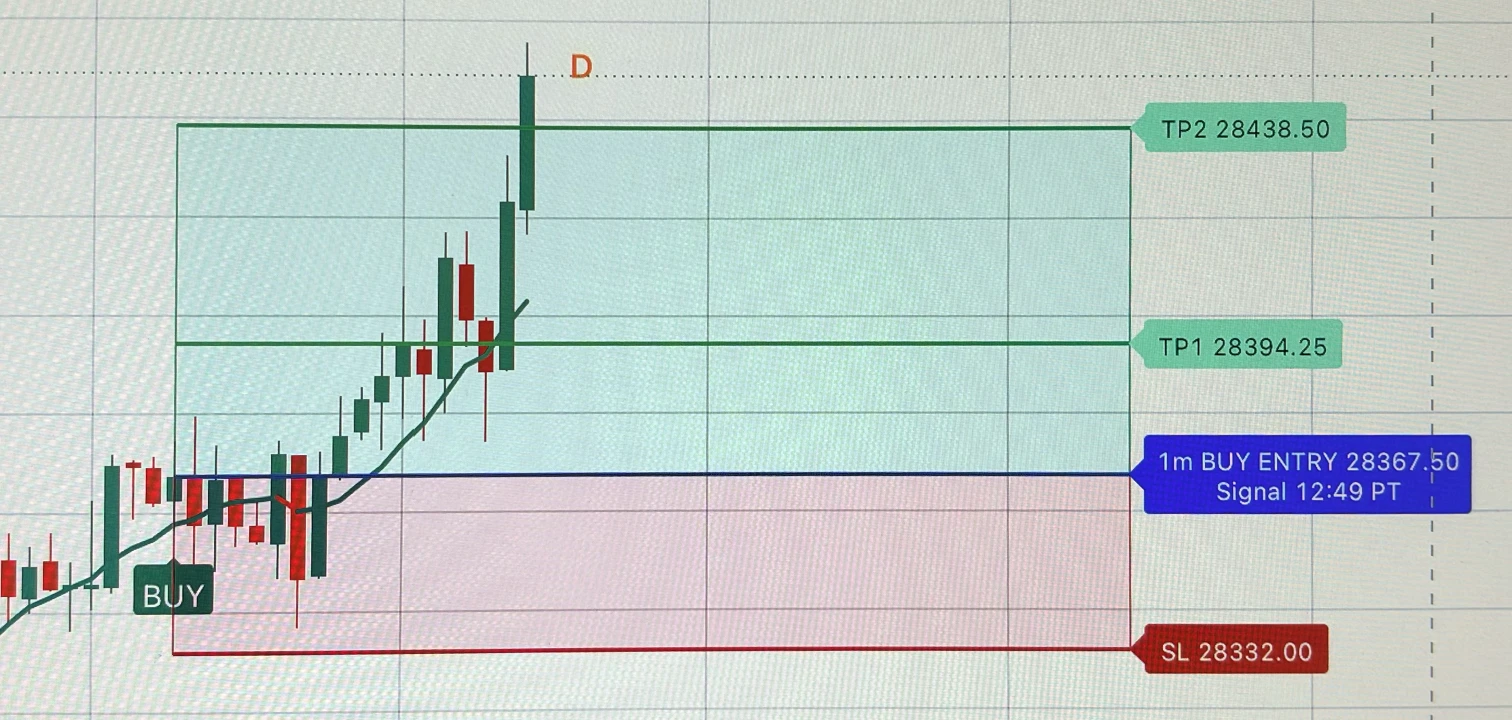
See the same MNQ BUY setup with price above both take-profit levels.
Historical chart on delayed data. The levels are indicator references. Actual fills and results can differ.
TradingView Strategy Tester
+$1,151,560365-day backtest P&L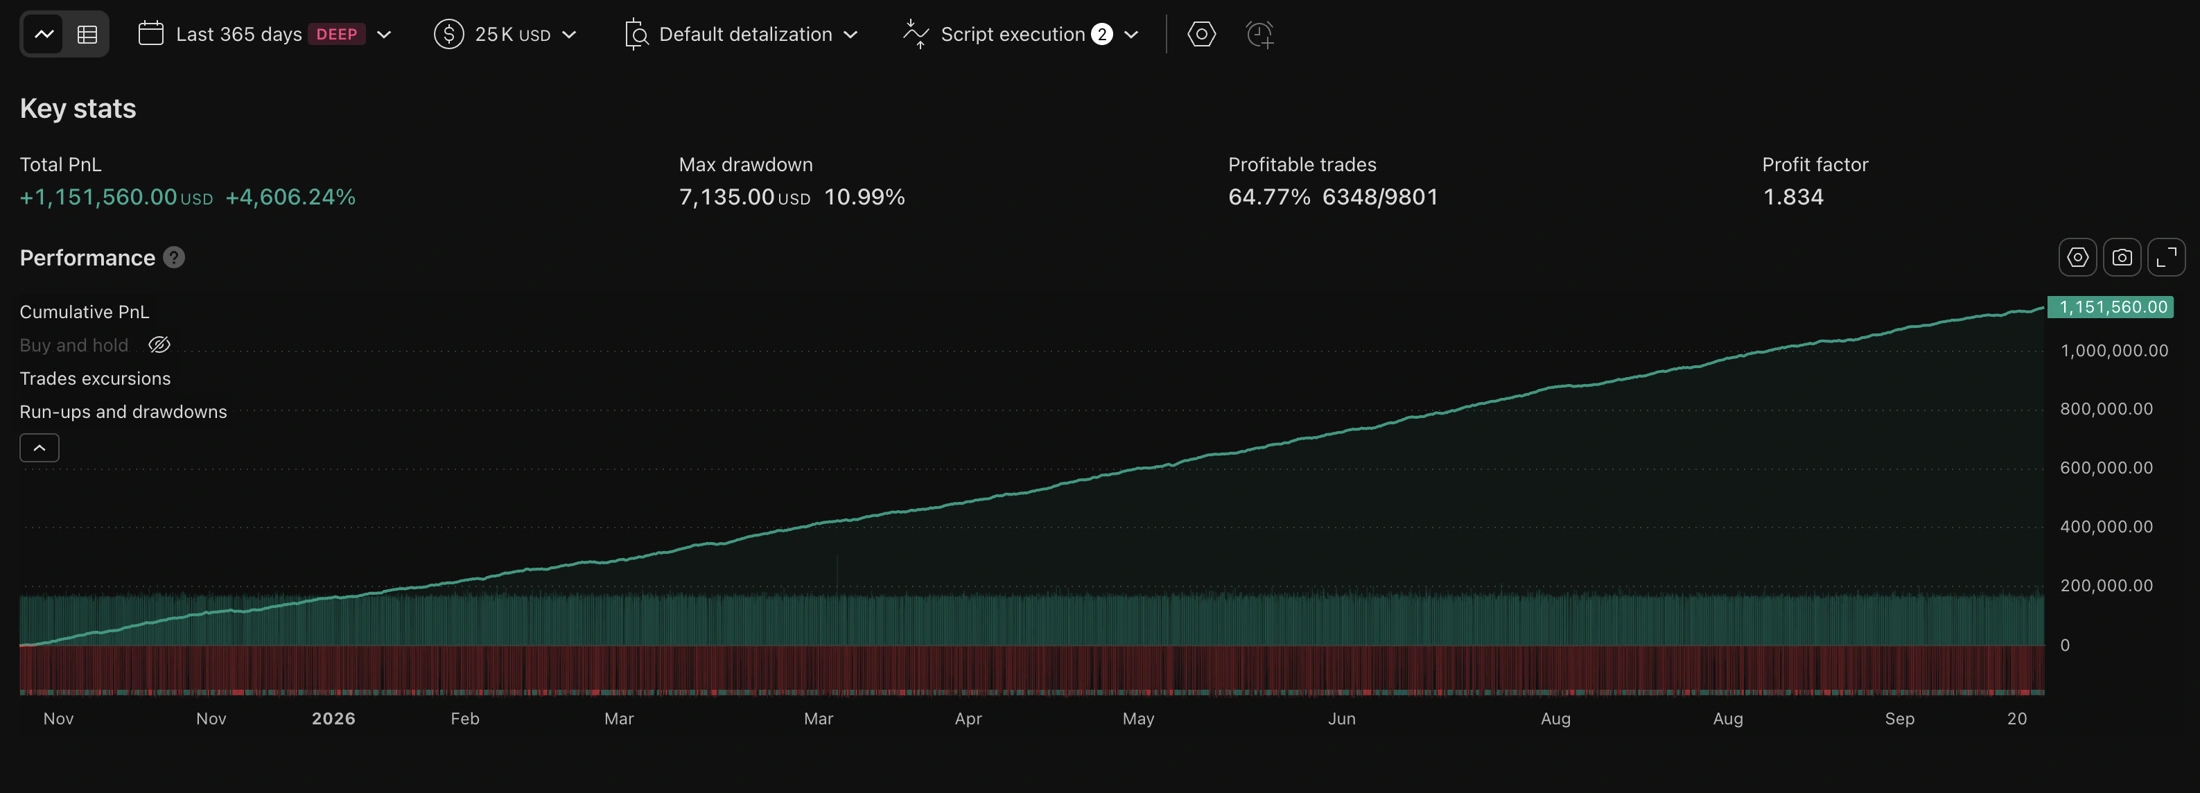
Tradesyncer · Account snapshot
$10,884.78Total profit displayed · June 10, 2026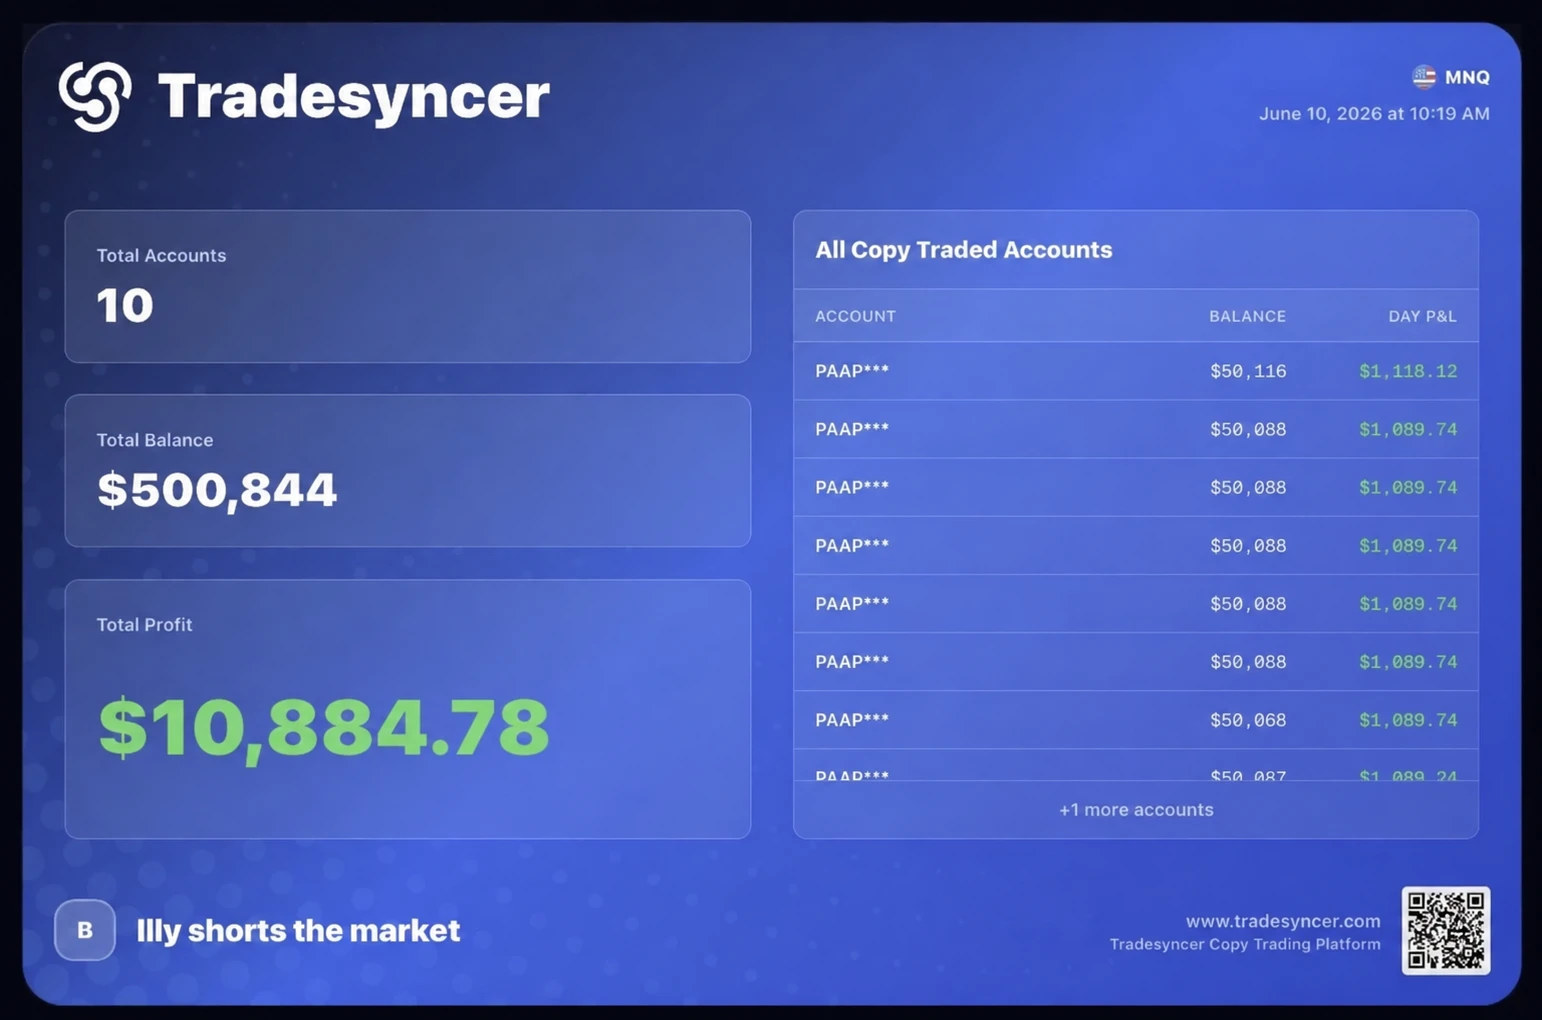
Four clips recorded during Nasdaq futures sessions, from the premarket to a short setup reaching TP1.
Marc shows the buy setup alongside the stop and limit he set.
Marc weighs whether to close as price reaches the first target.
Marc explains why he took a short based on his own chart reading.
Marc talks through a stop-loss as the price moves.
Selected historical recordings show earlier chart builds and Marc’s discretionary decisions. On-screen amounts can reflect open positions or order targets. These clips don’t establish typical trading results.
One indicator. Multiple markets. Built for TradingView.
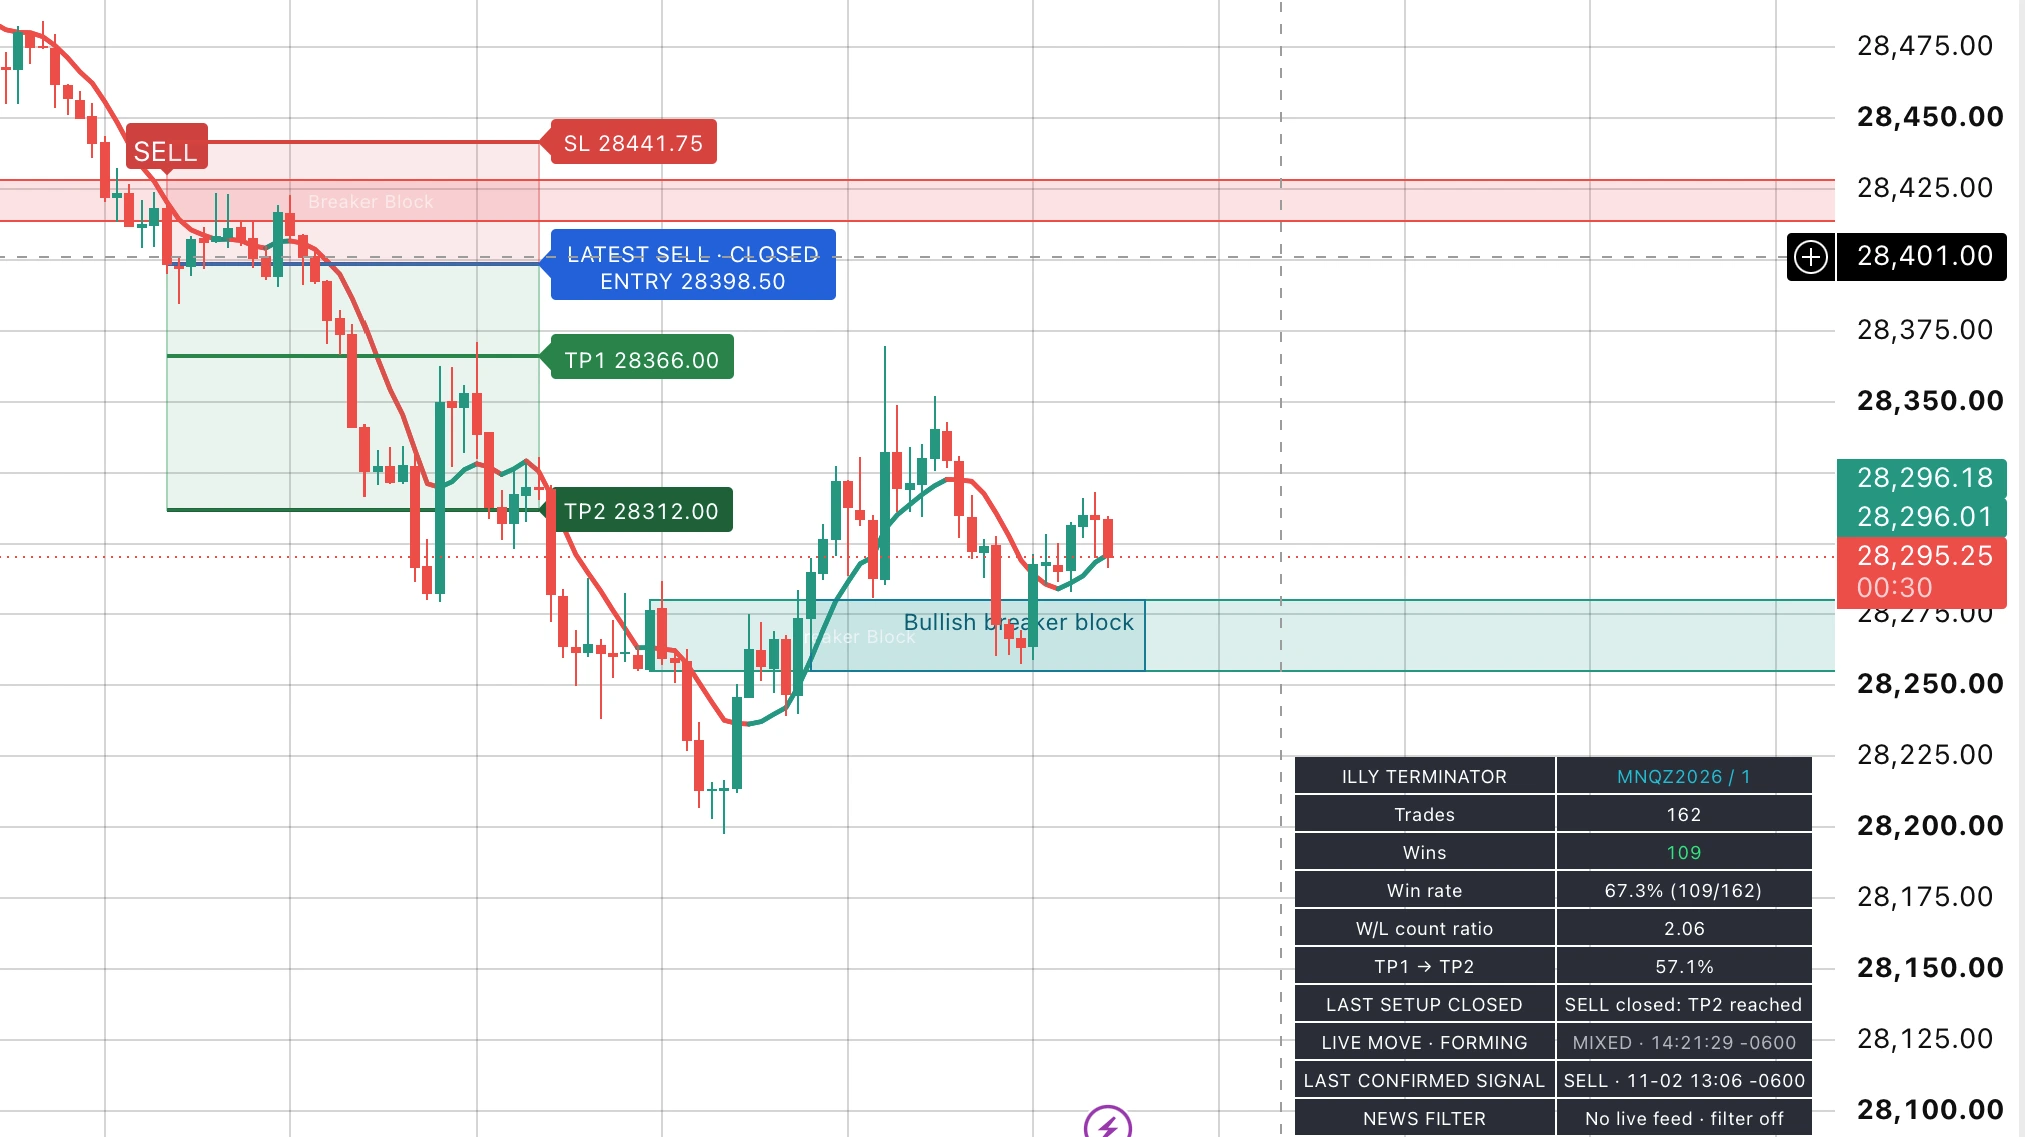
A BUY appears when the long entry conditions qualify.
A SELL appears when the short entry conditions qualify.
Blue marks entry. Red marks the stop-loss.
Both take-profit prices are marked in green.
A warning appears when an active setup weakens.
HISTORICAL PATTERNS. CLEAR SIGNALS.
Illy compares current conditions with historical patterns, then checks trend, candles and volume before showing a setup.
It can wait when conditions do not qualify. It can also lose. Historical similarity is not a promise of the next move.
Get AccessYOUR SETUP AT A GLANCE
INSTALLATION · CUSTOMER VERSION 1.6.2
Download and unzip the package from Whop. Open INSTALLATION.html and follow the illustrated steps.
Open TradingView’s desktop Pine Editor, paste the included Pine source, save, and add it to the chart.
Start with MNQ, standard candles, 1 minute, and the electronic session. Use the included settings guide.
SET UP. ADD TO CHART. SEE YOUR LEVELS.
Download the Pine script from Whop. Install it through TradingView’s desktop Pine Editor. Add it to your chart and start with the included settings guide.

Runs in TradingView on Mac and Windows browsers. Choose a market profile for your chart.
No native NinjaTrader, MetaTrader or broker automation is included. TradingView plans and exchange data may cost extra.
Nasdaq: NQ / MNQ
S&P 500: ES / MES
Other futures: custom settings
Gold and silver futures
Crude oil futures
Dedicated metals and oil profiles
Individual stocks
Exchange-traded funds
Stocks / ETFs profile
Bitcoin, Ethereum and other crypto charts
Dedicated crypto profile
Supported TradingView option symbols
Dedicated options profile
Custom profile for forex and other symbols
Data and volume availability vary by feed
These are chart/profile compatibility categories, not verified profitability across every market. Test each symbol and timeframe. The included baseline settings are for MNQ on standard 1-minute candles. TradingView is the supported platform.
Save your own copy of the readable TradingView source. Follow the illustrated guide to paste it into Pine Editor, save it and add it to your chart.
For traders using futures, stocks, ETFs, crypto, options and forex charts on TradingView.
ILLY CHARTS
365 days of use, downloads, updates and installation support.





Whop handles checkout and delivery. No automatic renewal. Taxes and available payment methods appear at checkout.
Requires a TradingView account that can run custom Pine indicators. TradingView subscriptions and exchange data are separate.
Customer download includes version 1.6.2. The 365-day term starts with your Whop membership. Contact support within 7 days of delivery for installation issues. If support cannot resolve the issue, a refund applies. Statutory rights remain unaffected.From historical patterns to a clear entry, stop and two targets. Here’s what the model checks.
The selected market profile and trading session set the starting conditions.
The similarity model looks for directional evidence in past conditions.
Trend and VWAP / EMA relationships help qualify direction for the entry route.
Movement, choppiness and recent trend flips help screen noisy conditions.
Candle direction, body and wick checks help qualify a completed setup.
Relative volume compares participation with the recent average.
Trend, breaker or opening-range routes use their own trigger conditions.
Stop-distance limits, cooldown and setup state are checked before a new entry.
Checks vary by entry route and settings. Exit-review advisories reassess an existing setup. This is analysis software; it does not execute orders or guarantee a result.
It displays confirmed BUY and SELL setups with entry, stop and target references. These are analysis signals, not personalized instructions or broker orders. You choose whether to trade.
No. A manual scheduled-event filter is being tested in the private build. It is not included in the version 1.6.2 customer download. No live headline or news-sentiment feed is included.
The indicator counts setups that touch halfway to TP1 before closing. That milestone is not the percentage of trades with final net profit. Fees, slippage and actual execution are separate.
No. Historical-pattern similarity supports the signal model. It does not know the future, manage your account or execute trades. No guaranteed earnings or win rate.
The script can load on different TradingView symbols. The included baseline is MNQ on standard 1-minute candles. BTC, gold and other markets require separate validation; universal profitability has not been established.
You receive the readable Illy Charts 1.6.2 Pine script, installation guide, baseline settings and troubleshooting guide through Whop. The $89 one-time purchase includes 365 days of software use, downloads, released updates and installation support. No automatic renewal.
Download and unzip your package from Whop. On TradingView desktop, open Pine Editor, create a new indicator, paste the supplied Pine source, then save and add it to your chart. Follow the included settings guide and check the setup on a chart before using signals. TradingView plans and market-data subscriptions are separate.
Yes. You receive readable Pine source to save in your own TradingView account. It plots BUY and SELL setups, entry, stop-loss, TP1, TP2 and REVIEW EXIT warnings. It does not place orders or manage your brokerage account.
No. The downloaded file can remain on your computer. It has no expiry lock, remote deletion or vendor kill switch. Your software-use license, downloads, released updates and support cover the stated 365-day term; keeping the file does not extend that license.
The current purchase is a software-use license. Resale and redistribution rights are not included in the delivered terms. Any reseller offer requires a separate written license covering what can be sold and the rights passed to buyers.
The signal model compares current chart conditions with fully labeled historical patterns and combines those results with trend, volume and risk checks. This is historical-pattern learning, not a guarantee of the next move. Experimental structure-ML entries are off by default in the supplied settings.